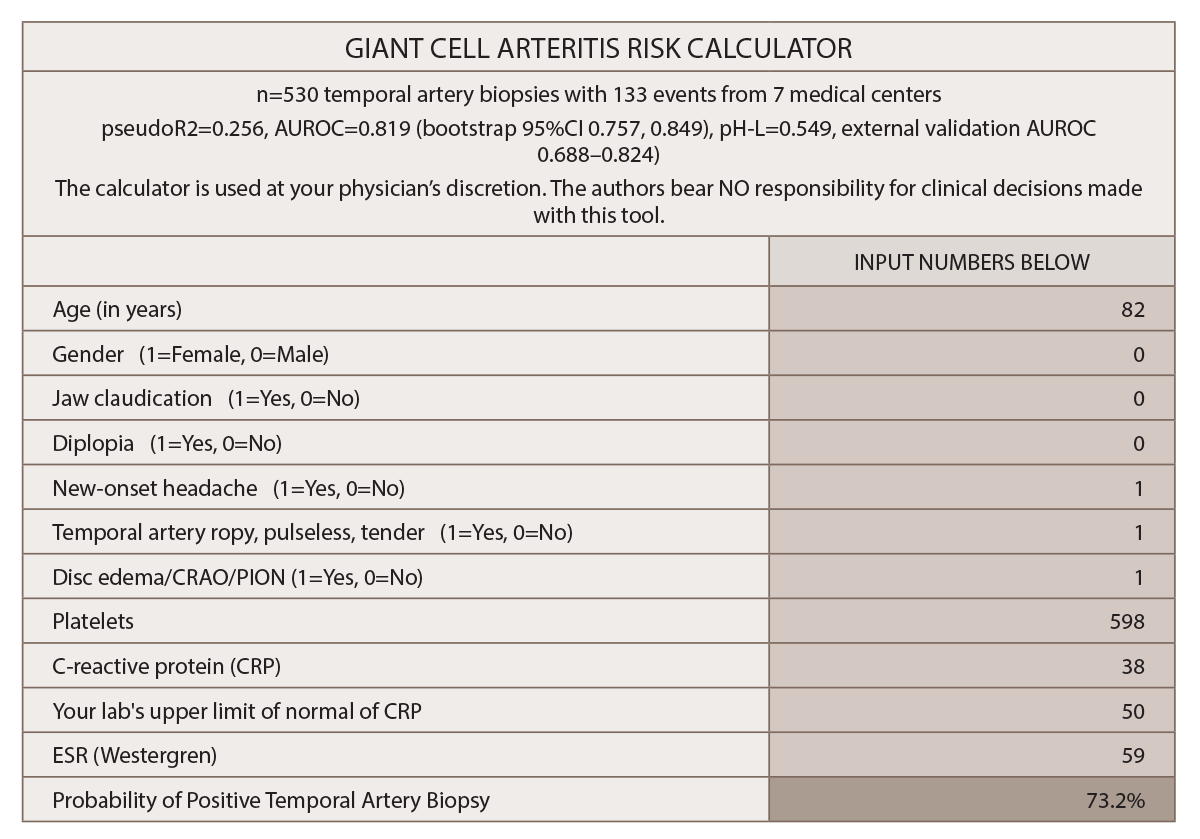
The a priori variables chosen for the prediction model included age, gender, jaw claudication, new-onset headache, clinical temporal artery abnormality, ischemic vision loss, diplopia, platelet level, erythrocyte sedimentation rate (ESR) and C-reactive protein (CRP). Only cases that had details on each of those variables were included in the analysis. According to Dr. Ing, one of the most difficult elements involved was finding patients with complete blood work results (i.e., ESR, CRP, platelets) who had had the temporal artery biopsy prior to 14 days of glucocorticoid therapy.
‘The prediction model provides a numeric final output probability of biopsy-proven GCA.’ —Dr. Ing
Statistically Significant Predictors
The data analysis found the statistically significant predictors of a positive temporal artery biopsy included age, jaw claudication, ischemic vision loss, higher platelet level and log CRP. The variables that were not statistically significant predictors included ESR, gender, new-onset headache and temporal artery abnormality.
Dr. Ing says the group found no surprises among the predictive variables. “It was interesting, however, to find that thrombocytosis, or elevated platelets, was such a strong predictor,” he says. “In our study, the log transform of the CRP divided by its upper limit of normal was a bigger predictor for GCA than the raw CRP.” In addition, he says, “[Because] ischemic vision loss (i.e., anterior ischemic optic neuropathy, posterior ischemic optic neuropathy, central retinal artery occlusion) was a statistically significant predictor for biopsy-proven GCA, this may explain why binocular diplopia was not.”

(click for larger image) Figure 1: Multivariable Prediction Model for Suspected Giant Cell Arteritis: Development & Validation
* Gender and diplopia were NOT predictive for GCA in this study.

(click for larger image) Source: Clinical Ophthalmology by Society for Clinical Ophthalmology (Great Britain). Reproduced with permission of Dove Medical Press Limited in The Rheumatologist via Copyright Clearance Center.
“The prediction model provides a numeric final output probability of biopsy-proven GCA so patients and their clinicians can objectively decide whether to initiate glucocorticoid therapy and/or undergo a temporal artery biopsy,” Dr. Ing says. The final model assigns a probability of a positive temporal artery biopsy based on the following variables: age, gender, jaw claudication, diplopia, new-onset headache, temporal artery abnormality, funduscopic abnormality, thrombocytosis, ESR and CRP.
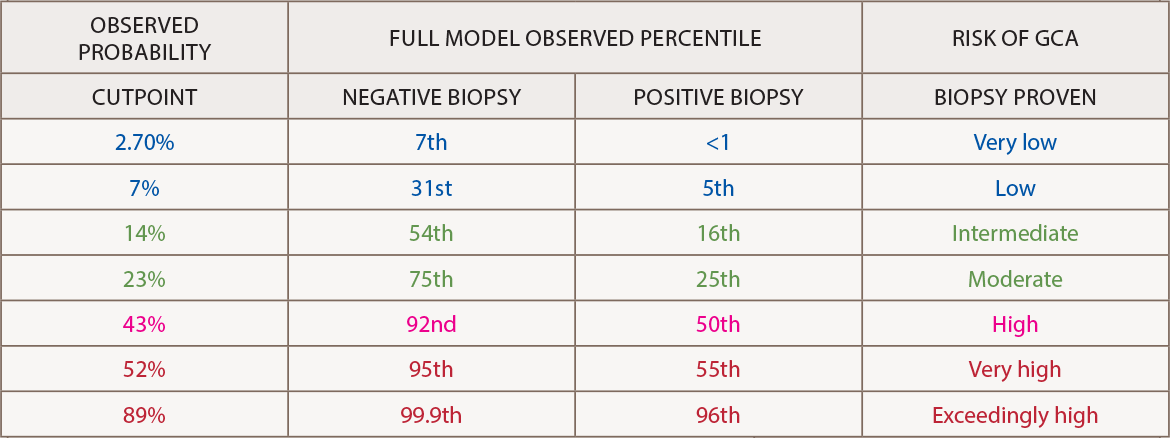
The output calculator should be interpreted in light of the cutpoint table. A nomogram for the 10-variable prediction model “allows clinicians without a formal training in statistics to graphically understand how the odds ratios and confidence intervals of each predictor contributes to the final probability for GCA on logistic regression,” he says.2

