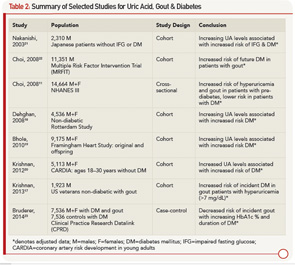
The complicated relationship between UA, gout and DM was described by Choi et al using the cross-sectional NHANES cohort. UA increases with rising HbA1c levels until reaching a level of 6–6.9%, after which UA levels decrease, creating an inverse U-shaped association when UA is plotted against HbA1c.11 UA demonstrates a similar inverse U-shaped curve when graphed against fasting glucose levels; however, UA increases linearly with increasing fasting C-peptide levels and homeostasis model assessment-estimated insulin resistance.11 This finding was notable in two aspects:
- UA levels appeared to be higher in the pre-diabetic phase and lower with overt DM; and
- Insulin (represented by C-peptide and HOMA-IR) and glucose appeared to have separate and independent effects on UA levels.
From a clinical standpoint, it appears that patients are at higher risk for gout in the pre-diabetic period, and patients with DM may indeed be protected. Table 2 outlines studies showing an increased risk of DM in patients with elevated UA and gout, as well as studies demonstrating the protective effect of DM for hyperuricemia and gout.
Mechanistically, insulin affects UA reabsorption via the kidney, as outlined above. In comparison, glucose is thought to reduce UA, with glucose levels higher than 180 mg/dL being uricosuric.11 The balance of hyperinsulinemia and hyperglycemia and the competing effect on renal urate clearance may explain the clinical observations. Inflammation is also a well-known component to the development of DM.
As discussed above, UA may have a role as a proinflammatory substrate. Accordingly, new pharmacologic considerations for managing DM include agents targeting inflammation, such as interleukin-1 beta (IL-1β) antagonists. This therapeutic approach is attractive given the success of IL-1β antagonists in the management of gout and the large number of patients with both DM and gout.24 Indeed, a case review of three patients with gout and DM treated with anakinra (IL-1β receptor antagonist) after failing conventional urate lowering and antiinflammatory therapy saw improvement in not only gout manifestations, but they also had decreased fasting glucose and HbA1c levels.25
Obesity
As we come to understand adipose tissue as a metabolically active entity, obesity and weight gain have also been implicated in gout. In fact, higher body mass index (BMI) and obesity have demonstrated the strongest association with hyperuriciemia and gout.26
Cross-sectional data from NHANES show that the prevalence of gout increases with increasing BMI even after adjustment for UA, with the prevalence being 1.3 times greater in overweight individuals and up to 2.2 times greater in the morbidly obese when compared with normal BMI.27 A prospective cohort study in women supports this, finding early- to mid-life obesity an independent risk factor for incident gout.28 Obesity has been associated with earlier onset gout. The age of incident gout decreases by 4.5 years with every 5 kg/m2 increase in BMI at age 21.29 Even in children 9–15 years old, UA levels have been found to be higher in those overweight.30

