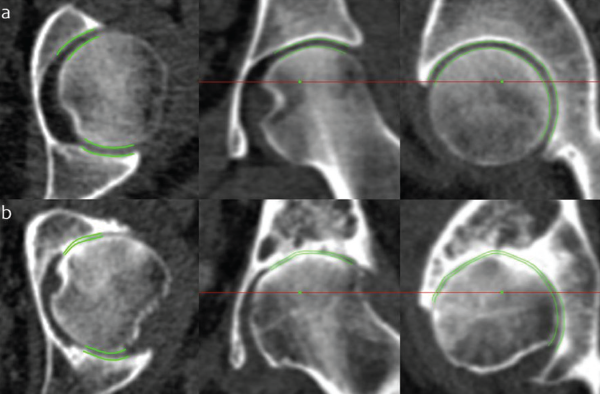
JSM performance at the extremes of disease. Joint space margins are shown in green as seen in axial, coronal and sagittal planes (left to right) at two left hips. (a) An individual with a radiographic K&L grade of 0 (no disease) and minimum joint space width of 2.0 mm. (b) An individual with a radiographic K&L grade of 3 (moderate disease) and minimum joint space width of 0 mm. This demonstrates that JSM is still able to represent joint space width as it approaches zero, important for analysis in advanced disease.
Credit: Reprinted by permission from “A new quantitative 3D approach to imaging of structural joint disease,” Scientific Reports, under the Creative Commons Attribution 4.0 International (CC BY) license (https://creativecommons.org/licenses/by/4.0/legalcode).
CT or MRI?
The researchers focused on CT scans rather than MRIs because the 3D information is richer, with better spatial resolution in all three planes. “We have been able to adapt the technique to work with MRI, but this has mainly focused on 3D mapping of cartilage thickness at the knee, which MRI is far better at visualizing,” Dr. Turmezei says. “It is still important to consider [CT] joint space mapping as complementary to other imaging techniques such as MRI, which has its own strengths over CT, such as the ability to depict soft tissues such as cartilage and ligaments as well as inflammation.” CT does better show mineralized structures, such as bone.
As MRI techniques develop, however, a similar 3D joint space mapping approach will likely become possible with clinical MRI data. Dr. Turmezei’s PhD thesis in 2017 showed it was feasible, but the sequences needed to do it are not in everyday clinical use. “One of the great strengths of CT joint space mapping is that it uses regular CT imaging data that can be acquired on any hospital scanner right now,” he says.